SINE AND COSINE FUNCTIONS
Example 1:
Given g(x) = 2 sin(2x), do the following:
a. State the amplitude:
The amplitude of the graphs of sine and cosine is |a| where a is the coefficient of the sine or cosine function.
Given a = 2, then |2| = 2 is the amplitude.
b. State the EXACT period:
The period formula of the graphs of sine and cosine is
where b is the coefficient of some angle x.
Given b = 2, the period is
. This means the representative picture is
units in length.
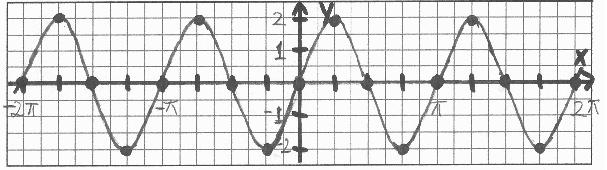
c. Sketch the function on the interval
by hand.
(1) Keep in mind the graph and characteristics of the basic sine function!
(2) Mark off a distance along the x-axis starting at the origin to represent the period
(3) Divide this period into four equal intervals. Each will be of length
(4) Create the representative picture by using the beginning and ending point of each interval.
Note that the x-values are integer multiples of
Specifically, the points will be (0, 0), (
2), and (
(5) Connect the points to form the representative picture of the sine function.
(6) Copy several more cycles in the same manner to the right and left of the representative pictureon the interval
Please note that the peaks and valleys in the graphs of the sine functions are U-shaped!
Note that the units along the x-axis are DIFFERENT from the units along the y-axis! As long as you place numbers along your axes it does not matter "how long" your units are!
Example 2:
Given
, do the following:
a. State the amplitude.
The amplitude of the graphs of sine and cosine is |a| where a is the coefficient of the sine or cosine function.
Given a =
, then
is the amplitude.
b. State the EXACT period.
The period formula of the graphs of sine and cosine is
Given b =
. This means the representative picture is 2 units in length.
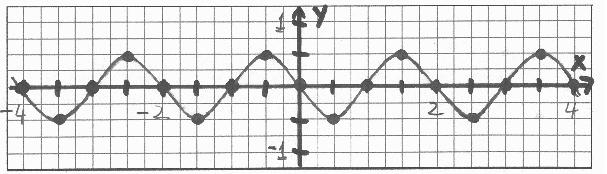
c. Sketch the function on the interval
by hand.
(1) Keep in mind the graph and characteristics of the basic sine function!
(2) Mark off a distance along the x-axis starting at the origin to represent the period 2.
(3) Divide this period into four equal intervals. Each will be of length 2/4 = 1/2.
(4) Create the representative picture by using the beginning and ending point of each interval.
Note that the x-values are integer multiples of 1/2 and the y-values must be calculated using the x-values. Use a calculator!
Specifically, the points will be (0, 0), (1/2,
Please note that "a" is negative! This means that the representative picture is reflected in the x-axis. Instead of drawing a peak first, we will draw a valley instead!
(5) Connect the points to form the representative picture of the sine function.
(6) Copy several more cycles in the same manner to the right and left of the representative picture on the interval
Please note that the peaks and valleys in the graphs of the sine functions are U-shaped!
Note that the units along the x-axis are DIFFERENT from the units along the y-axis! As long as you place numbers along your axes it does not matter "how long" your units are!
Example 3:
Given
, do the following:
a. State the amplitude.
The amplitude of the graphs of sine and cosine is |a| where a is the coefficient of the sine or cosine function.
Given a = 2, then |2| = 2 is the amplitude.
b. State the EXACT period.
The period formula of the graphs of sine and cosine is
Please note that
. Therefore, b =
, the period is
. This means the representative picture is 4
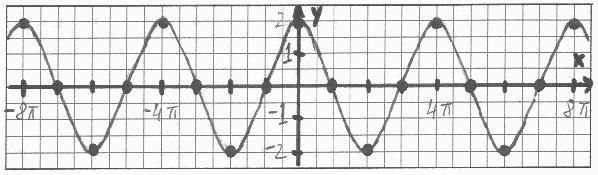
c. Sketch the function on the interval
by hand.
(1) Keep in mind the graph and characteristics of the basic cosine function!
(2) Mark off a distance along the x-axis starting at the origin to represent the period 4
(3) Divide this period into four equal intervals. Each will be of length 4
(4) Create the representative picture by using the beginning and ending point of each interval.
Note that the x-values are integer multiples of
Specifically, the points will be (0, 2), (
(5) Connect the points to form the representative picture of the cosine function.
(6) Copy several more cycles in the same manner to the right and left of the representative picture on the interval
Please note that the peaks and valleys in the graphs of the cosine functions are U-shaped!
Note that the units along the x-axis are DIFFERENT from the units along the y-axis! As long as you place numbers along your axes it does not matter "how long" your units are!
Example 4:
Given
, do the following:
a. State the amplitude.
The amplitude of the graphs of sine and cosine is |a| where a is the coefficient of the sine or cosine function.
Given a =
b. State the EXACT period.
The period formula of the graphs of sine and cosine is
Please note that
. Therefore, b =
, the period is
. This means the representative picture is 4 units in length.
c. Sketch the function on the interval
by hand.
(1) Keep in mind the graph and characteristics of the basic cosine function!
(2) Mark off a distance along the x-axis starting at the origin to represent the period 4 .
(3) Divide this period into four equal intervals. Each will be of length 4/4 = 1.
(4) Create the representative picture by using the beginning and ending point of each interval.
Note that the x-values are integer multiples of 1 and the y-values must be calculated using the x-values. Use a calculator!
Specifically, the points will be (0,
Please note that "a" is negative! This means that the representative picture is reflected in the x-axis. Instead of drawing a peak first, we will draw a valley instead!
(5) Connect the points to form the representative picture of the cosine function.
(6) Copy several more cycles in the same manner to the right and left of the representative picture on the interval
Please note that the peaks and valleys in the graphs of the cosine functions are U-shaped!
Note that the units along the x-axis are DIFFERENT from the units along the y-axis! As long as you place numbers along your axes it does not matter "how long" your units are!
Example 5:
Given the function
a. State the amplitude.
The amplitude of the graphs of sine and cosine is |a| where a is the coefficient of the sine or cosine function.
Given a = 2, then |2| = 2 is the amplitude.
b. State the EXACT period.
The period formula of the graphs of sine and cosine is
Please note that
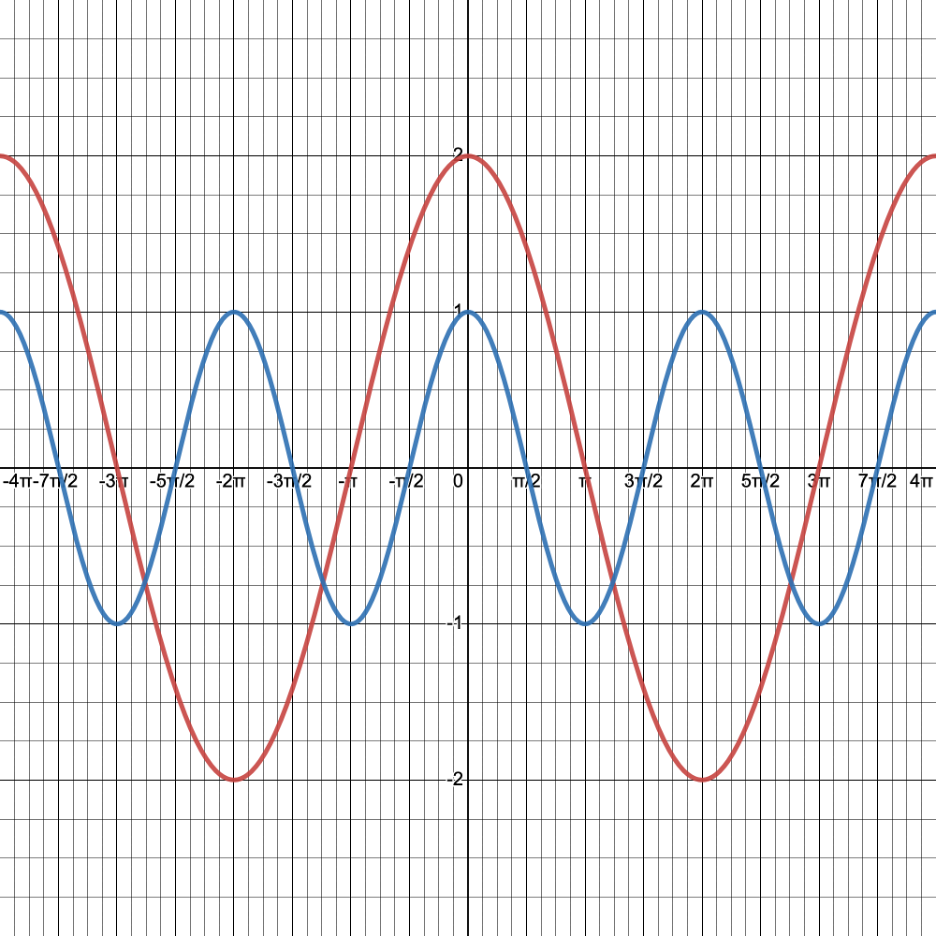
c. Use Desmos at https://www.desmos.com/calculator to draw the graph of y = cos(x) and that of its transformation
Required Desmos Graph Characteristics:
- Show the representative picture and a copy of one to the right of it.
- Place numbers on both axes.
- The x-axis numbers must contain
- The y-axis numbers must show the appropriate values for the x-axis numbers used in (3).
- Do not make the y-axis too large. We need to see the peaks and valleys clearly!
You can find instructions for Desmos at https://profstewartmath.com/Math127/A_CONTENTS/desmos.htm
NOTE:
Sometimes, we have to try different settings in the Desmos "Graph Settings" window before the required x-axis numbers show up. Additionally, when we export the image, we need to determine which size best shows all required characteristics.
In the graph above, the Desmos "Graph Settings" for the x-axis are between
The "Large Square" size was used for Desmos image export. Incidentally, the other settings refused to show all of the x-axis numbers.