TANGENT, COTANGENT, COSECANT, AND SECANT FUNCTIONS
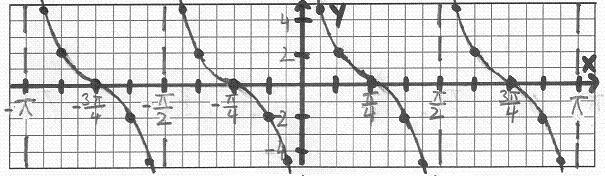
Example 1:
Given
, do the following:
a. State the EXACT period.
Since b = 2, the period is
/2. This means that the representative picture is
b. Sketch the function on the interval
by hand.
(1) Keep in mind the graph and characteristics of the basic cotangent function!
(2) Mark off a distance along the x-axis starting at the origin to represent the period
(3) Divide this period into four equal intervals. Each will be of length
4 =
1/4 =
(4) Draw dashed vertical lines at the beginning and end of the period to represent the vertical asymptotes (do not draw the y-axis as a dashed line).
(5) Create the appropriate representative picture by using three points marking the intervals.
Note that the x-values are integer multiples of
/8 and the y-values must be calculated using the x-values. Use a calculator!
Specifically, the points will be (
2).
(6) Connect the points to form the representative picture of the cotangent function.
(7) Copy several more cycles in the same manner to the right and left of the representative picture on the interval
- Please note the concavities of the graph of the cotangent function.
- Also, each branch continues to head toward the vertical asymptotes without ever "getting there." Do not draw the branches parallel to the asymptotes.
Note that the units along the x-axis are DIFFERENT from the units along the y-axis! As long as you place numbers along your axes it does not matter "how long" your units are!
c. Find the EXACT equations of the two vertical asymptotes that the representative picture approaches.
The vertical asymptotes occur at the beginning and end of the representative picture. Knowing the period and the location of the representative picture, the EXACT equations of the two vertical asymptotes are
x = 0 and x =
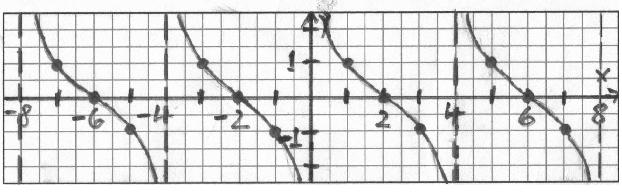
Example 2:
Given is the function
, do the following:
a. State the EXACT period.
Since b =
/4, the period is as follows:
This means that the representative picture is 4 units in length.
b. Sketch the function on the interval [
(1) Keep in mind the graph and characteristics of the basic tangent function!
(2) Mark off a distance along the x-axis starting at the origin to represent the period 4. Note that the representative picture of the tangent function is bisected by the y-axis!
(3) Divide this period into four equal intervals. Each will be of length 1.
(4) Draw dashed vertical lines at the beginning and end of the period to represent the vertical asymptotes (do not draw the y-axis as a dashed line).
(5) Create the appropriate representative picture by using three points marking the intervals.
Note that the x-values are integer multiples of 1 and the y-values must be calculated using the x-values. Use a calculator!
Specifically, the points will be (
(6) Connect the points to form the representative picture of the tangent function.
(7) Copy several more cycles in the same manner to the right and left of the representative picture on the interval [
- Please note the concavities of the graph of the tangent function.
- Also, each branch continues to head toward the vertical asymptotes without ever "getting there." Do not draw the branches parallel to the asymptotes.
Note that the units along the x-axis are DIFFERENT from the units along the y-axis! As long as you place numbers along your axes it does not matter "how long" your units are!
c. Find the EXACT equations of the two vertical asymptotes that the representative picture approaches.
The vertical asymptotes occur at the beginning and end of the representative picture. Knowing the period and the location of the representative picture, the EXACT equations of the two vertical asymptotes are
x =
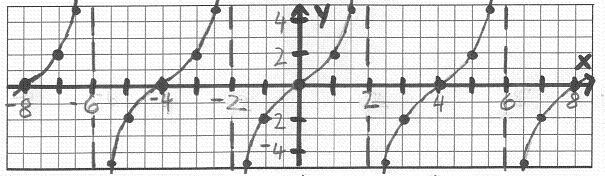
Example 3:
Given
, do the following:
a. State the EXACT period.
Since b =
This means that the representative picture 4 units in length.
b. Sketch the function on the interval
by hand.
(1) Keep in mind the graph and characteristics of the basic cotangent function!
(2) Mark off a distance along the x-axis starting at the origin to represent the period 4.
(3) Divide this period into four equal intervals. Each will be of length 1.
(4) Draw dashed vertical lines at the beginning and end of the period to represent the vertical asymptotes (do not draw the y-axis as a dashed line).
(5) Create the appropriate representative picture by using three points marking the intervals.
Note that the x-values are integer multiples of 1 and the y-values must be calculated using the x-values. Use a calculator!
Specifically, the points will be (1, 1), (2, 0), and (3,
(6) Connect the points to form the representative picture of the tangent function.
(7) Copy several more cycles in the same manner to the right and left of the representative picture on the interval
- Please note the concavities of the graph of the cotangent function.
- Also, each branch continues to head toward the vertical asymptotes without ever "getting there." Do not draw the branches parallel to the asymptotes.
Note that the units along the x-axis are DIFFERENT from the units along the y-axis! As long as you place numbers along your axes it does not matter "how long" your units are!
c. Find the EXACT equations of the two vertical asymptotes that the representative picture approaches.
The vertical asymptotes occur at the beginning and end of the representative picture. Knowing the period and the location of the representative picture, the EXACT equations of the two vertical asymptotes are
x = 0 and x = 4
Example 4:
Given is the function
, do the following:
a. State the EXACT period.
Since b =
, the period of our tangent function is calculated as follows:
This means that the representative picture is 2
b. Sketch the function on the interval
by hand.
(1) Keep in mind the graph and characteristics of the basic tangent function!
(2) Mark off a distance along the x-axis starting at the origin to represent the period 2
(3) Divide this period into four equal intervals. Each will be of length 2
(4) Draw dashed vertical lines at the beginning and end of the period to represent the vertical asymptotes (do not draw the y-axis as a dashed line).
(5) Create the appropriate representative picture by using three points marking the intervals.
Note that the x-values are integer multiples of
Specifically, the points will be (
(6) Connect the points to form the representative picture of the tangent function.
(7) Copy several more cycles in the same manner to the right and left of the representative picture on the interval
- Please note the concavities of the graph of the tangent function.
- Also, each branch continues to head toward the vertical asymptotes without ever "getting there." Do not draw the branches parallel to the asymptotes.
Note that the units along the x-axis are DIFFERENT from the units along the y-axis! As long as you place numbers along your axes it does not matter "how long" your units are!
c. Find the EXACT equations of the two vertical asymptotes that the representative picture approaches.
The vertical asymptotes occur at the beginning and end of the representative picture. Knowing the period and the location of the representative picture, the EXACT equations of the two vertical asymptotes are
x =
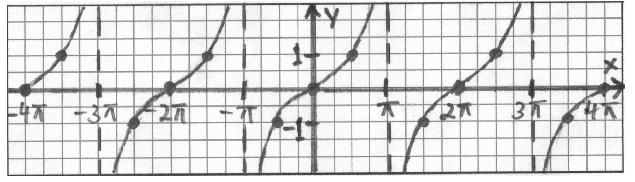
Example 5:
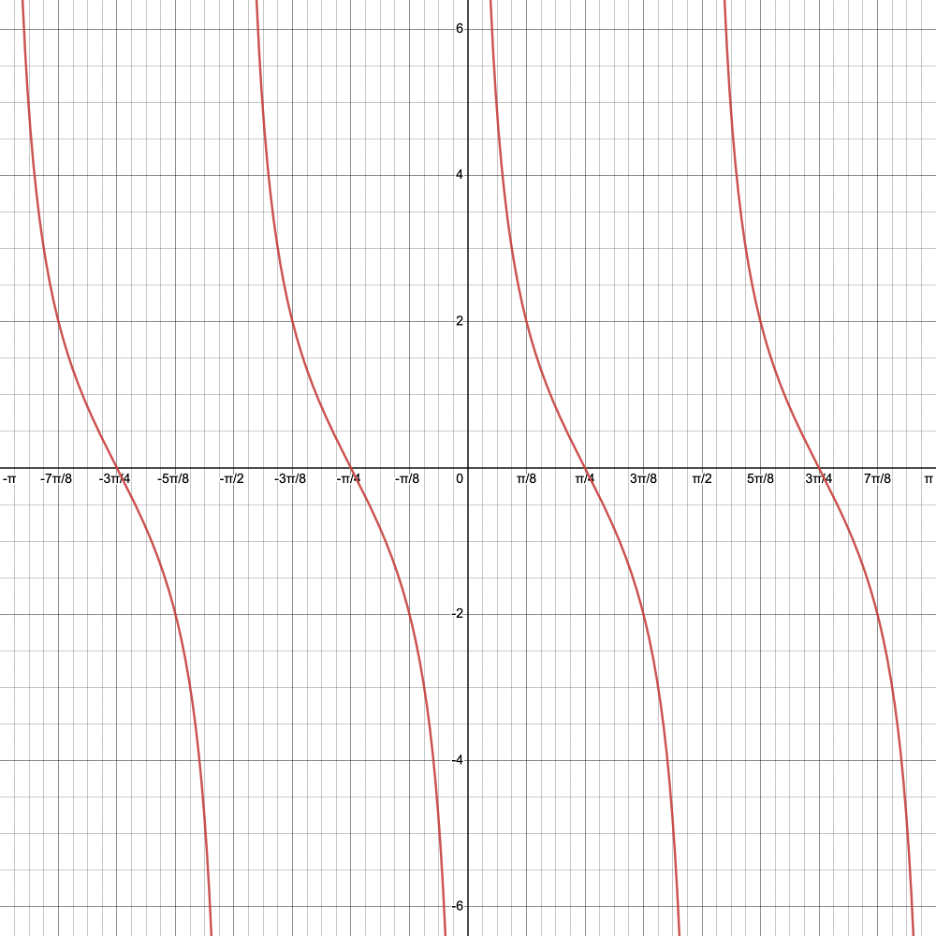
Given the function
a. State the EXACT period.
Since b = 2, the period is
b. Use Desmos at https://www.desmos.com/calculator to draw the graph.
Required Graph Characteristics:
- Show the representative picture and copies of one to the left of it and two to the right of it.
- Place numbers on both both axes.
- The x-axis numbers must contain
- The y-axis numbers must show the appropriate values for the x-axis numbers used in (3).
- Do not make the y-axis too large. We need to see the concavities clearly!
You can find instructions for Desmos at https://profstewartmath.com/Math127/A_CONTENTS/desmos.htm
Since b = 2, the period is
Considering the value a = 2, the y-axis can be between
NOTE:
Sometimes, we have to try different settings in the Desmos "Graph Settings" window before the required x-axis numbers show up. Additionally, when we export the image, we need to determine which size best shows all required characteristics.
In the graph above, the Desmos "Graph Settings" for the x-axis are between
The "Large Square" size was used for Desmos image export. Incidentally, the other settings refused to show all of the x-axis numbers.