SINE AND COSINE FUNCTIONS
Copyright by Ingrid Stewart, Ph.D. Please Send Questions and Comments to
ingrid.stewart@csn.edu.
![]()
Learning Objectives - This is what you must know after studying the lecture and doing the practice problems!
1. Memorize the shape and characteristics of the graph of the basic sine function.
2. Memorize the shape and characteristics of the graph of the basic cosine function.
3. Find the amplitude of transformations of the basic sine and cosine functions.
4. Find the period of transformations of the basic sine and cosine functions.
5. Sketch certain transformations of the basic sine and cosine functions.
![]()
We will now create functions out of the trigonometric ratios. In this lesson, we will look at the basic sine and cosie functions and their graphs. We will also examine some transformations.
The Basic Sine Function and its Graph
The sine function is called "periodic" because its graph consists of identical pictures that repeat forever.
The domain consists of all real numbers. The domain consists of all number replacements for x that don't make y = f(x) undefined or imaginary.
Please note that the numbers in the domain of ALL trigonometric functions are considered to be radians. NO degree measure can be used in their domain.
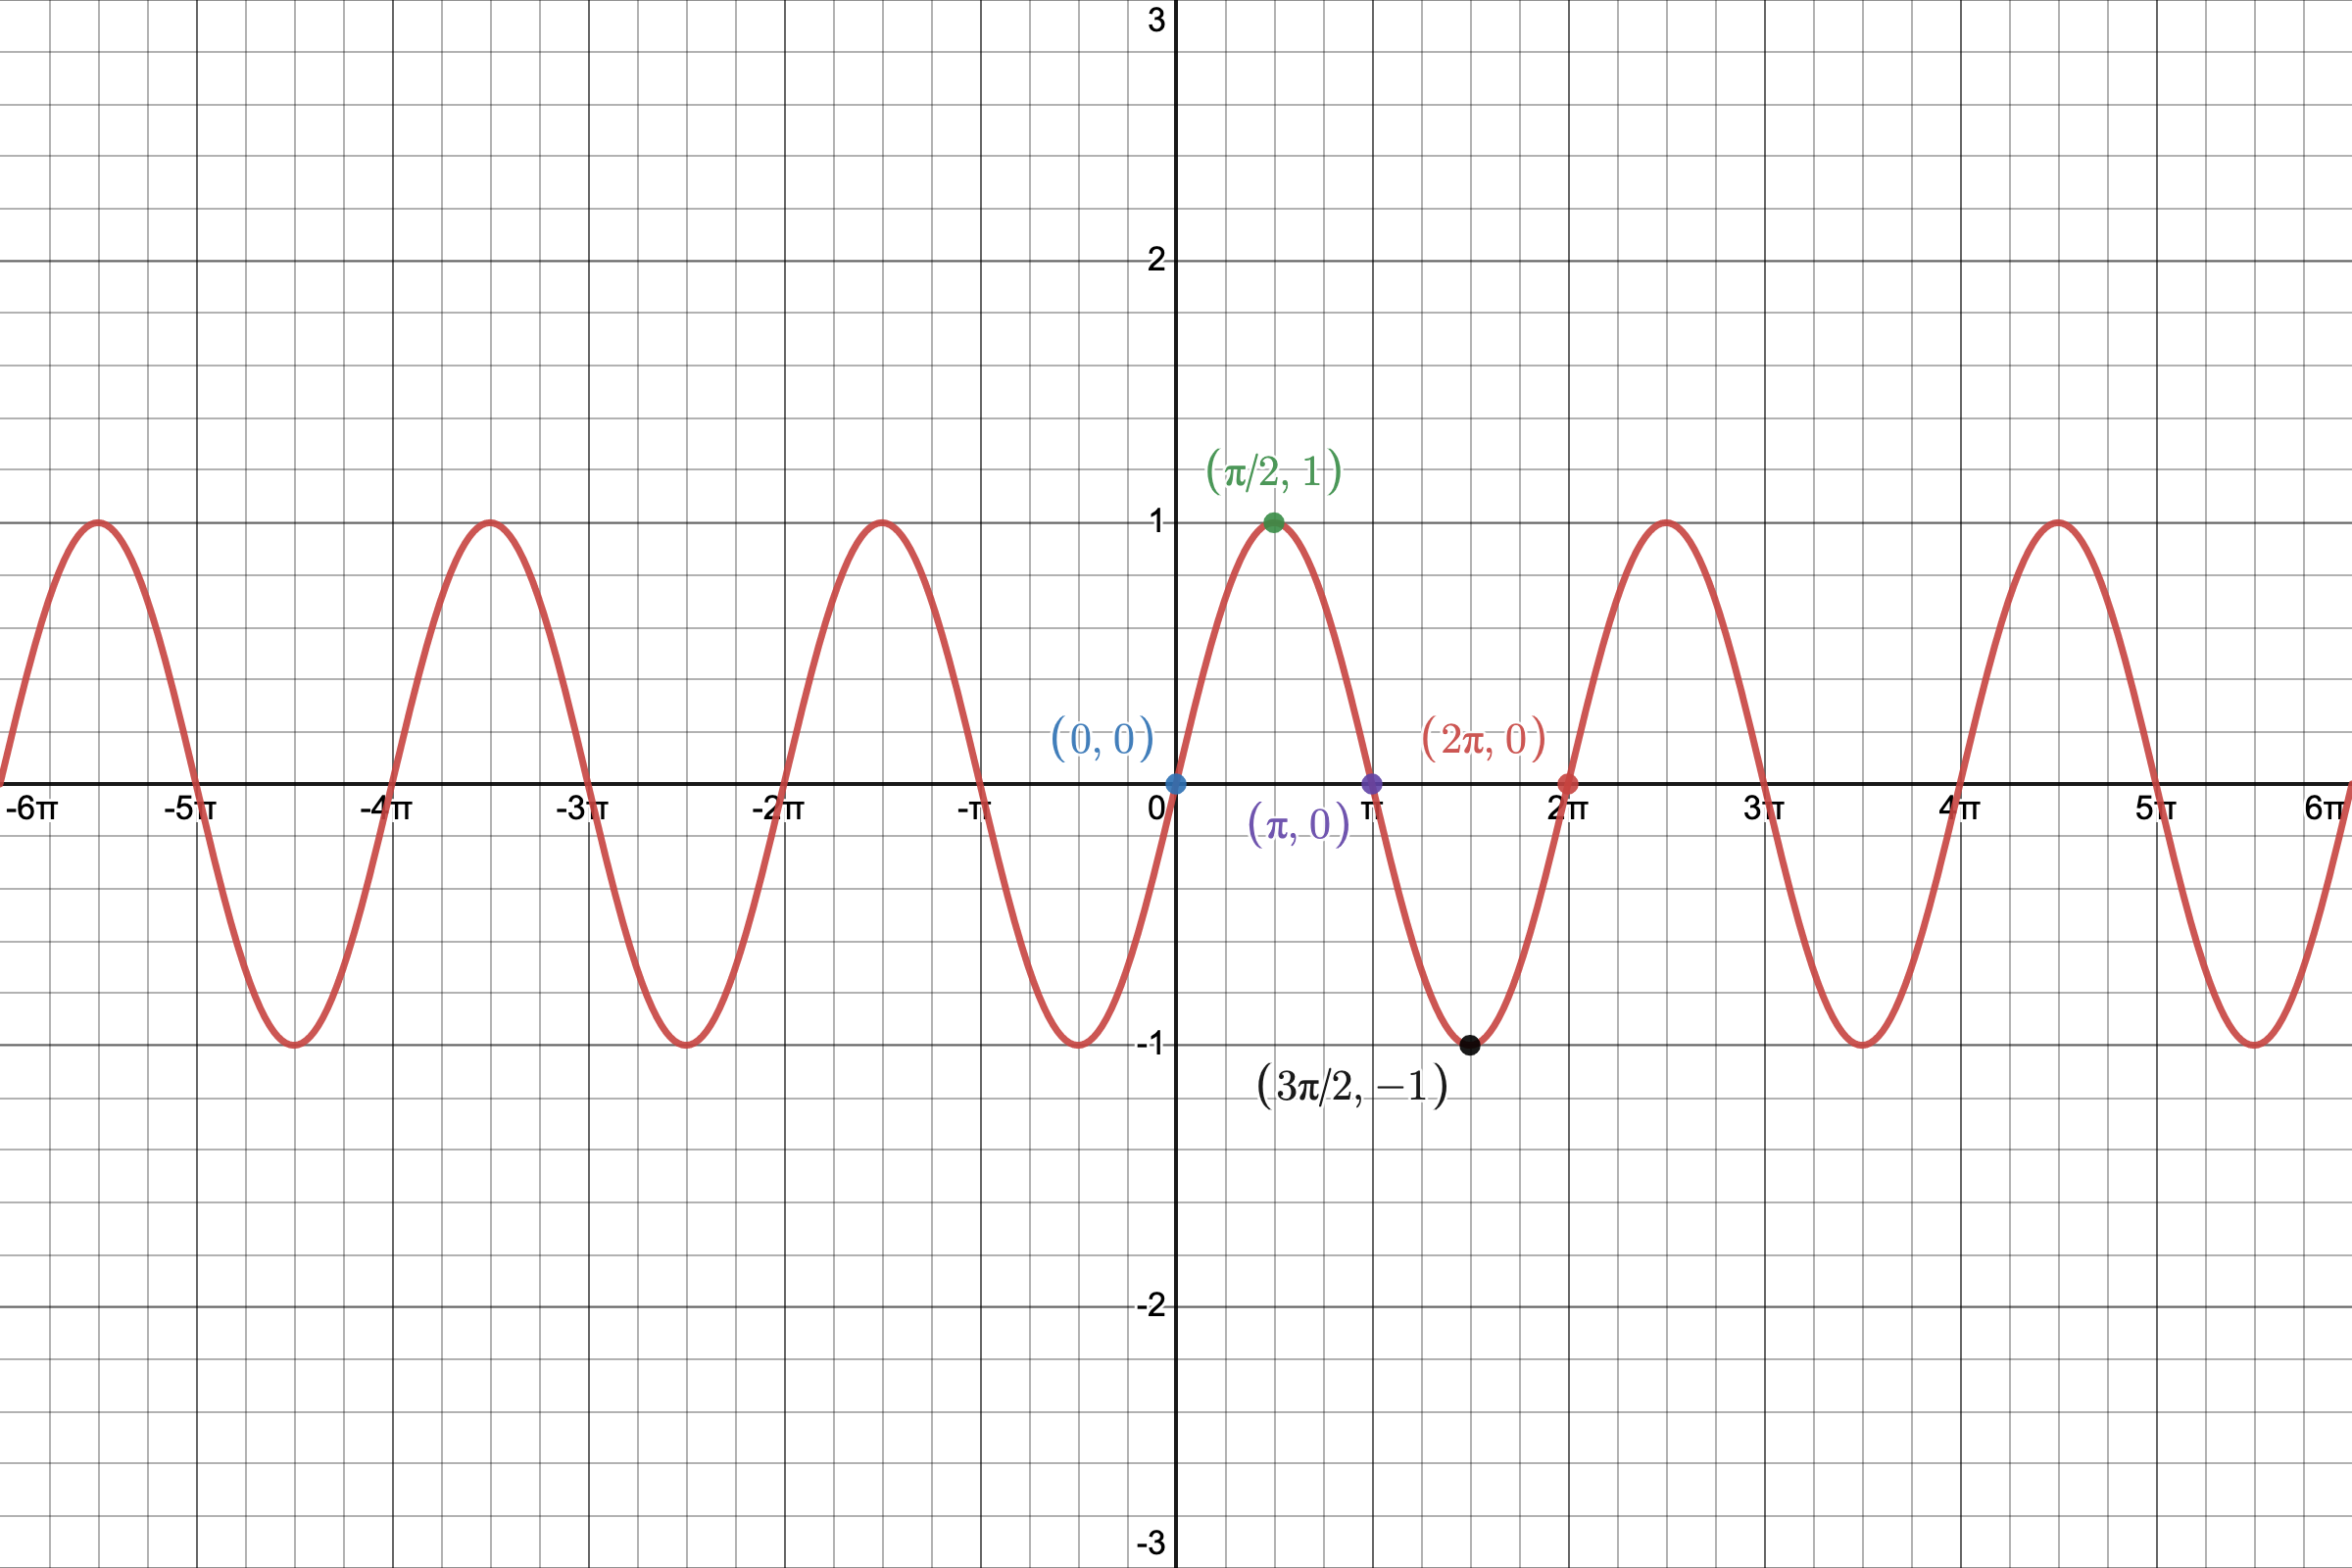
We will use the Desmos online graphing calculator to make a picture of
. You can find instructions on how to use Desmos at https://profstewartmath.com/Math127/A_CONTENTS/desmos.htm
YOU MUST MEMORIZE THE SHAPE AND CHARACTERISTICS OF ITS GRAPH
Given
, we can create the following table using the x-values (in radians) labeled in the picture above. They are all Quadrantal Angles!
NOTE:
etc. (use the calculator, if necessary!)
We will plot these points in a coordinate system and then connect them keeping in mind the shape of the graph.
We call this portion of the graph of the sine function its representative picture. It lies on the interval interval
which is called the PERIOD of the sine graph. Clearly, it is
in length.
The representative picture repeats "forever" along the positive and negative x-axis and creates the graph of the basic sine function.
Please note that its peak and valley are U-shaped!
Note that the representative picture is divided into four equal intervals.
- The graph starts at the origin where there is an x-intercept.
- At the end of the first interval the graph has a peak.
- At the end of the second interval the graph has an x-intercept.
- At the end of the third interval, the graph has a valley.
- At the end of the fourth interval the graph has an x-intercept
The Basic Cosine Function and its Graph
The cosine function is also called "periodic" because its graph also consists of identical pictures that repeat forever.
The domain consists of all real numbers.
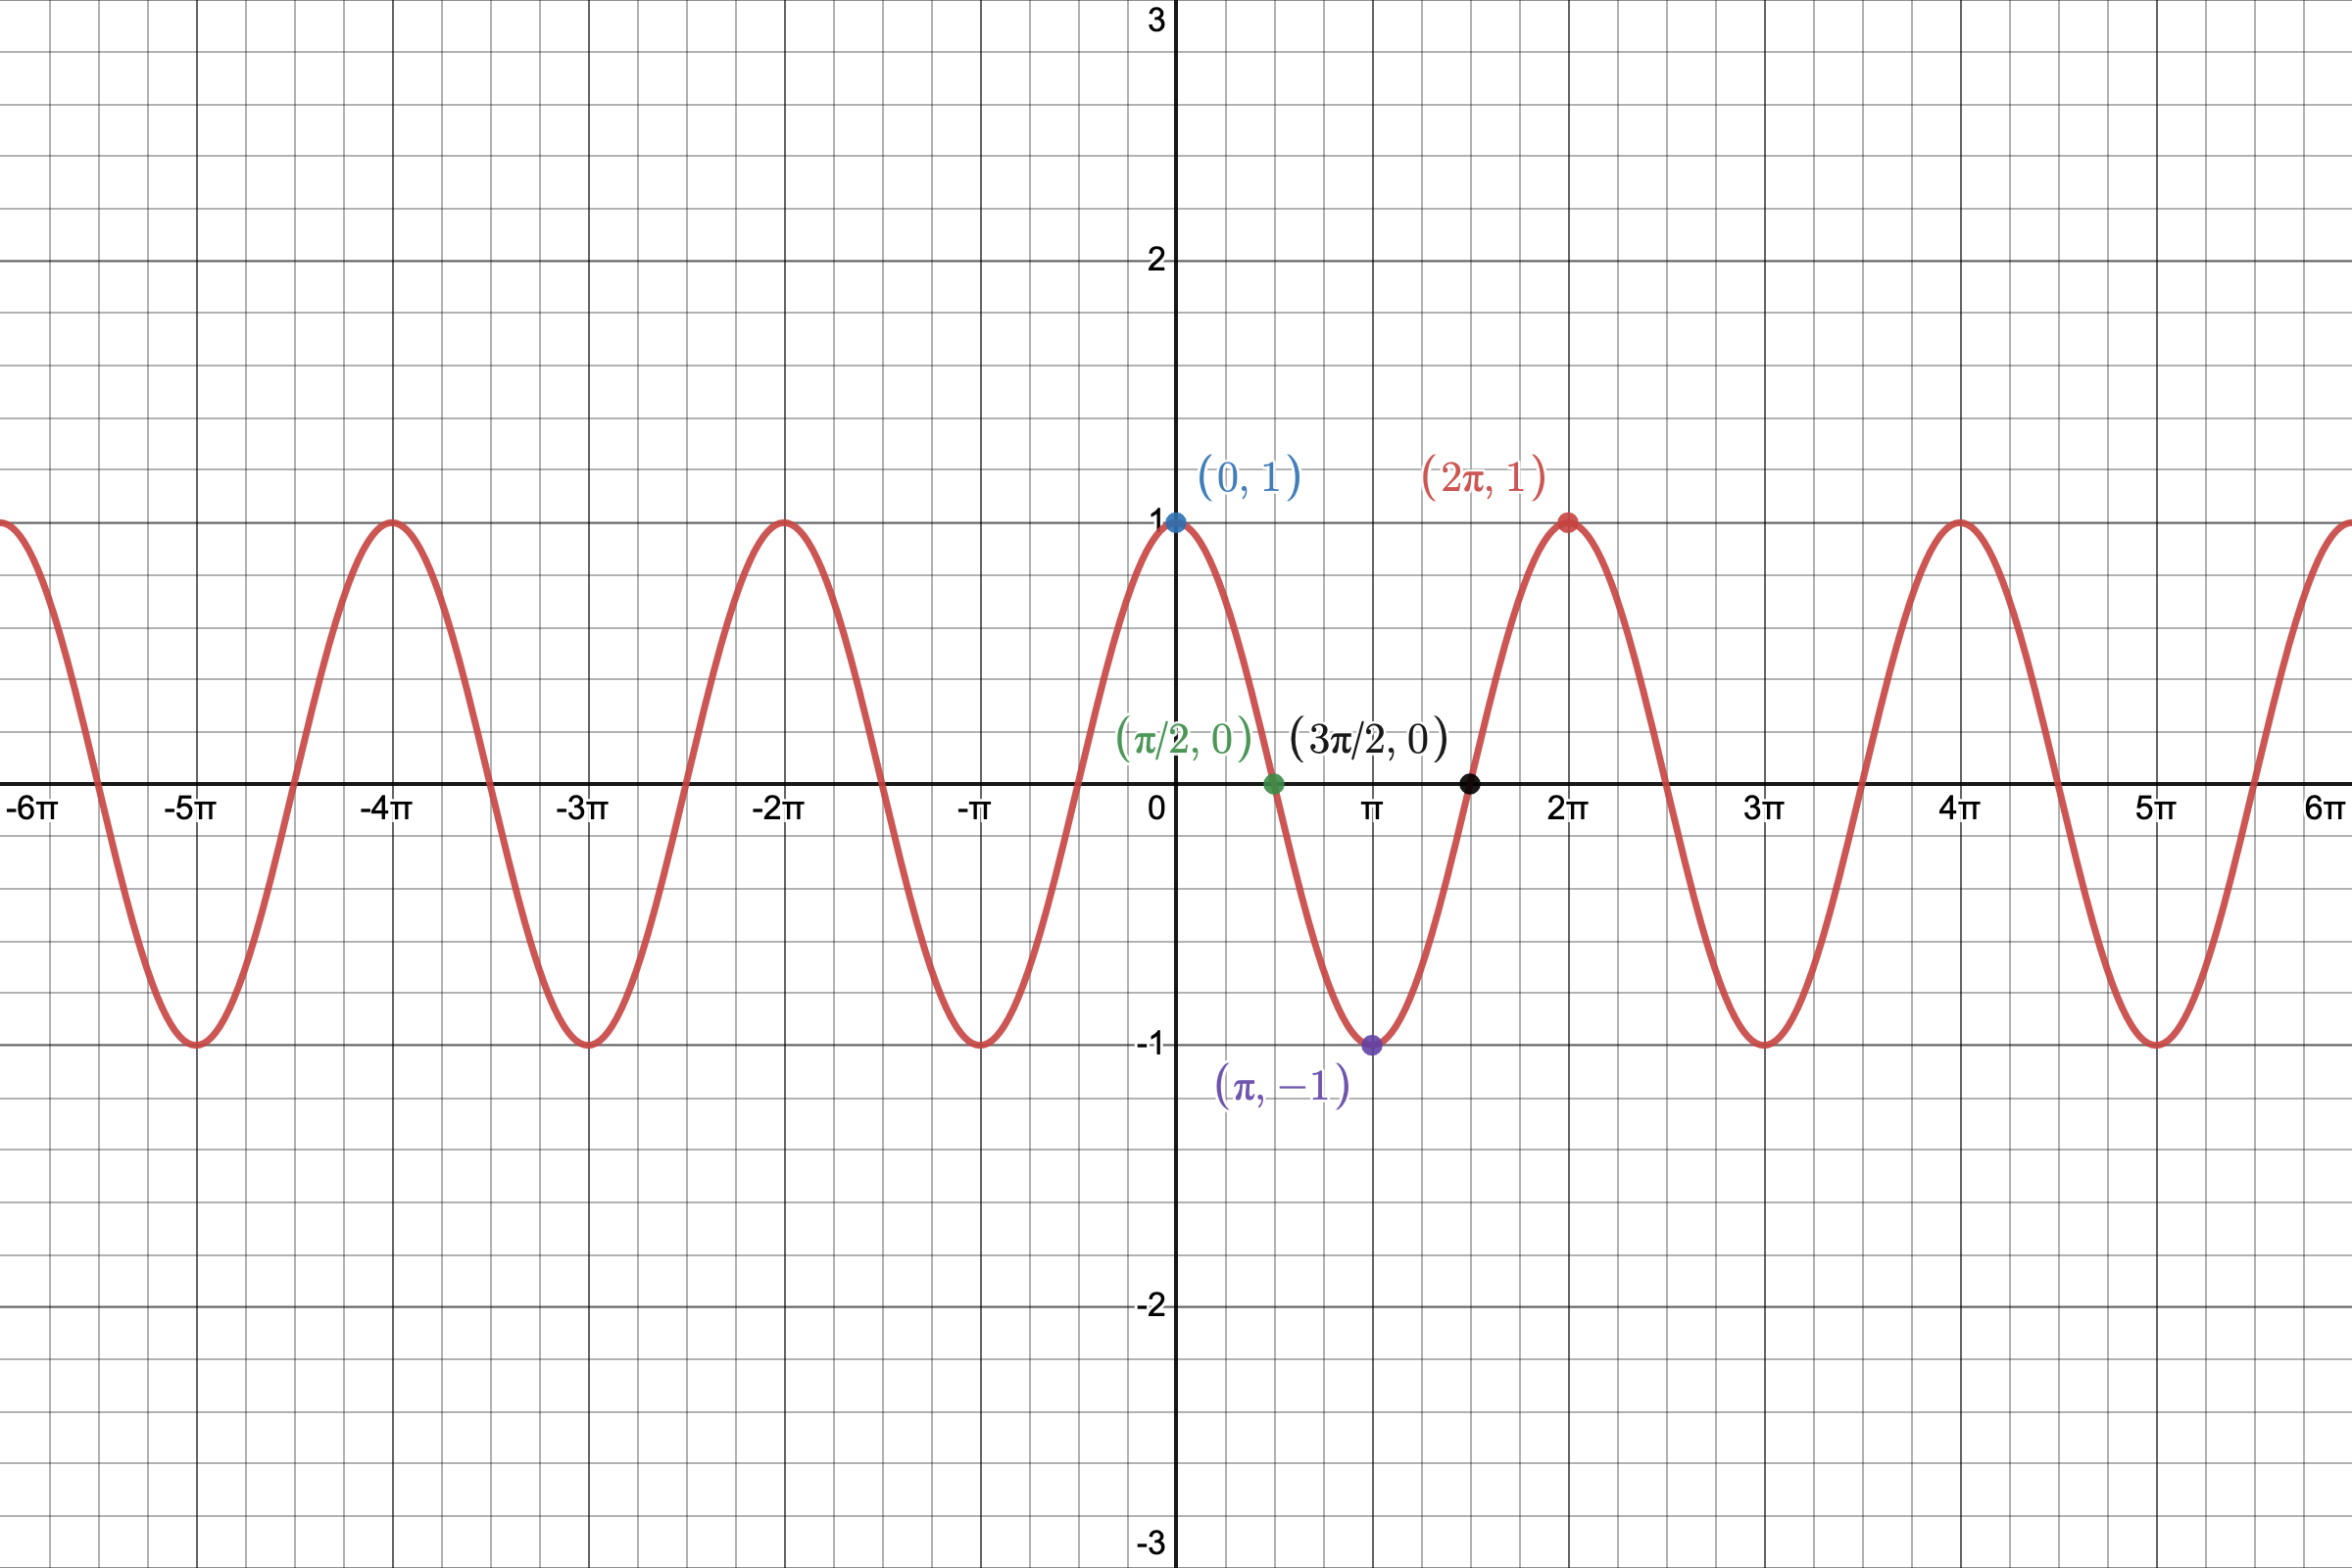
We will use the Desmos online graphing calculator to make a picture of
. You can find instructions on how to use Desmos at https://profstewartmath.com/Math127/A_CONTENTS/desmos.htm
YOU MUST MEMORIZE THE SHAPE AND CHARACTERISTICS OF THE GRAPH
Given
, we can create the following table using the x-values (in radians) labeled in the picture above. They are all Quadrantal Angles!
NOTE:

etc. (use your calculator, if necessary!)
We will plot these points in a coordinate system and then connect them keeping in mind the shape of the graph.
We call this portion of the graph of the cosine function its representative picture. It lies on the interval interval
which is called the PERIOD of the cosine graph. Clearly, it is
in length.
The representative picture repeats "forever" along the positive and negative x-axis and creates the graph of the basic cosine function. Please note the difference between the representative picture of the sine function and that of the cosine function!
Please note that its two peaks and one valley are U-shaped!
Note that the representative picture is divided into four equal intervals.
- The graph starts at (0, 1) where there is a peak.
- At the end of the first interval the graph has an x-intercept.
- At the end of the second interval the graph has a valley.
- At the end of the third interval, the graph has an x-intercept.
- At the end of the fourth interval the graph has a peak.
Transformations of the Basic Sine and Cosine Functions - see #1 through 5 in the "Examples" document
Next, we will investigate transformations of the basic sine and cosine functions. We will let a, b, c, and d be real numbers with a and b NOT equal to 0.
The transformations will then be described as follows:
and
NOTE:
From algebra, we should remember that transformations allow us to move and resize basic functions by shifting them vertically and horizontally; by reflecting them in the x- and y-axis; and by vertically and horizontally stretching and compressing them.
The number a
indicates a vertical stretch or compression of the graph of the basic sine and cosine functions. The absolute value of a or |a| is called the AMPLITUDE.
EXAMPLES:
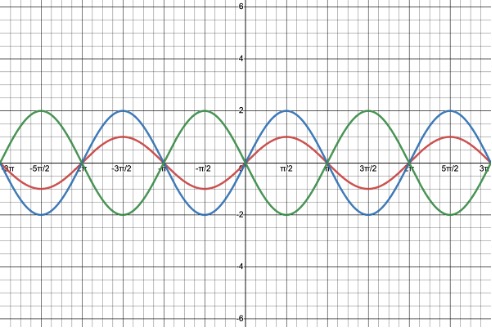
Following are the graphs of y = sin(x), y = 2 sin(x), and y =
2 sin(x).
We used the Desmos online graphing calculator to make their pictures. You can find instructions on how to use Desmos at https://profstewartmath.com/Math127/A_CONTENTS/desmos.htm
Please note that if the number a is negative, the representative picture is reflected in the x-axis. Please compare the green graph and the blue graph!
red graph:
y = sin(x), amplitude a = |1| = 1
blue graph:
y = 2 sin(x), amplitude a = |2|, a vertical stretch of y = sin(x)
green graph:
y =
2 sin(x), amplitude a = |
2| = 2, a vertical stretch of y = sin(x).
Additionally, since a is negative, we also have a reflection in the x-axis. Notice that the representative picture has a valley first and then a peak.
The number b
indicates a horizontal stretch or compression of the graph of the basic sine and cosine functions. This will affect the length of the PERIOD.
If b is between 0 and 1, the period of the basic sine and cosine function gets larger.
If b is greater than 1, the period of the basic sine and cosine function gets smaller.
The formula
calculates the period P of the graph of the sine and cosine functions.
EXAMPLES:
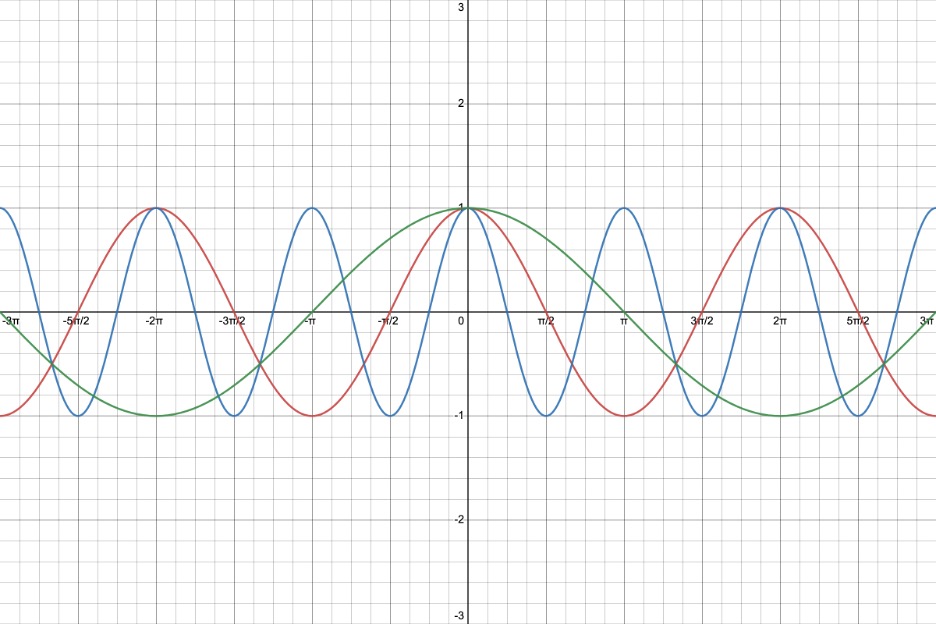
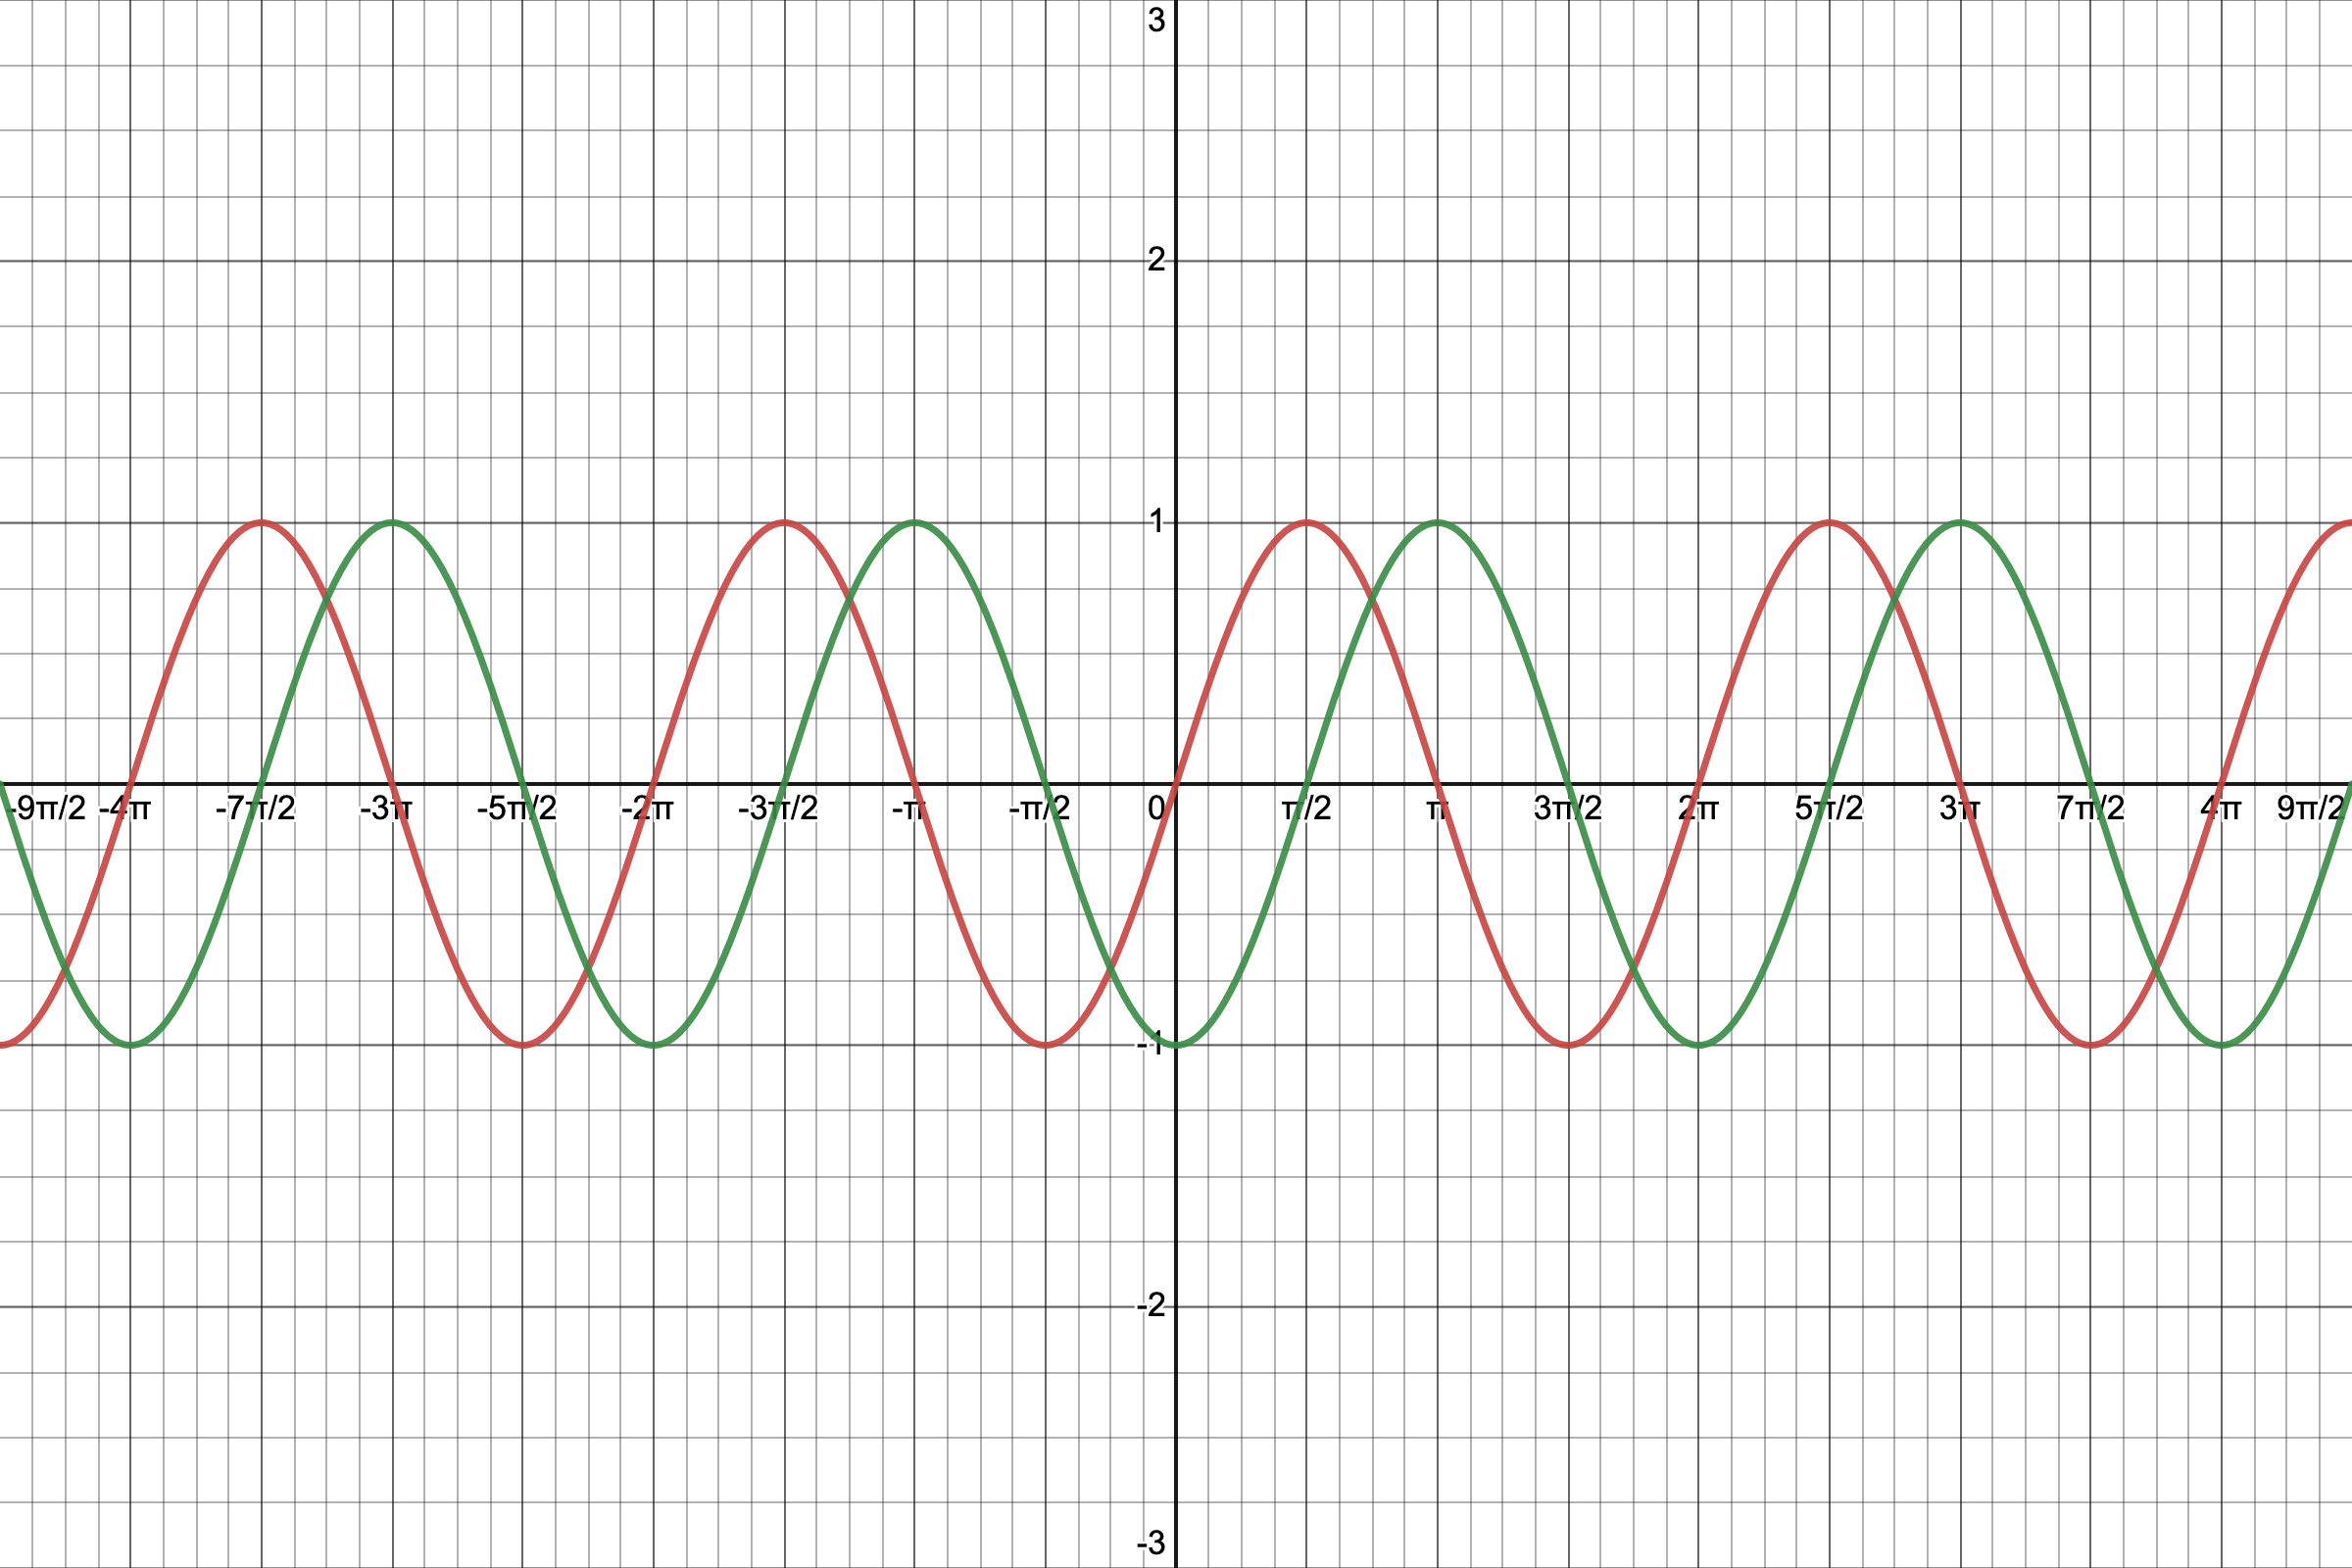
Following are the graphs of y = cos(x), y = cos(2x), and y = cos(
x).
We used the Desmos online graphing calculator to make their pictures. You can find instructions on how to use Desmos at https://profstewartmath.com/Math127/A_CONTENTS/desmos.htm
red graph:
y = cos(x), b = 1 then the period P is
blue graph:
y = cos(2x), b = 2 then the period P is
. This is a horizontal compression of y = cos(x) because the period is less than
.
green graph:
y = cos(
x) , b =
then the period P is
.
This is a horizontal stretch of y = cos(x) because the period is greater than
.
The number c
indicates a horizontal shift to the right or left of the graph of the basic sine and cosine functions. This is often called a PHASE SHIFT.
EXAMPLES:
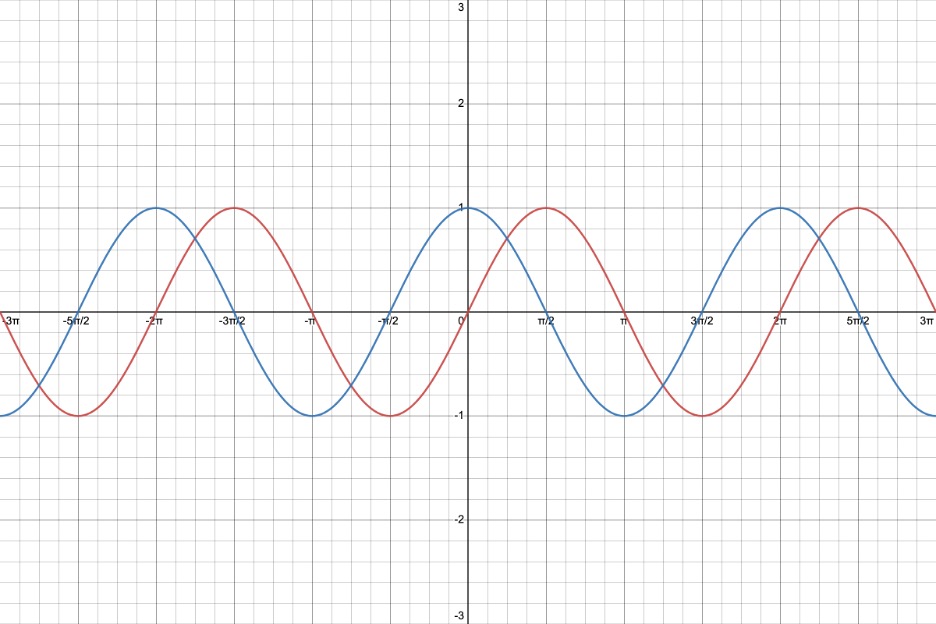
Following are the graphs of y = sin(x) and y = sin(x +
/2).
We used the Desmos online graphing calculator to make their pictures. You can find instructions on how to use Desmos at https://profstewartmath.com/Math127/A_CONTENTS/desmos.htm
red graph:
y = sin(x)
blue graph:
y = sin(x +
/2), c = +
/2 which indicates a shift to the LEFT of the graph of y = sin(x)
EXAMPLES:
Following are the graphs of y = sin(x) and y = sin(x
/2).
We used the Desmos online graphing calculator to make their pictures. You can find instructions on how to use Desmos at https://profstewartmath.com/Math127/A_CONTENTS/desmos.htm
red graph:
y = sin(x)
green graph:
y = sin(x
/2), c =
/2 which indicates a shift to the RIGHT of the graph of y = sin(x)
The number d
indicates a vertical shift up or down of the graph of the basic sine and cosine functions.
EXAMPLES:
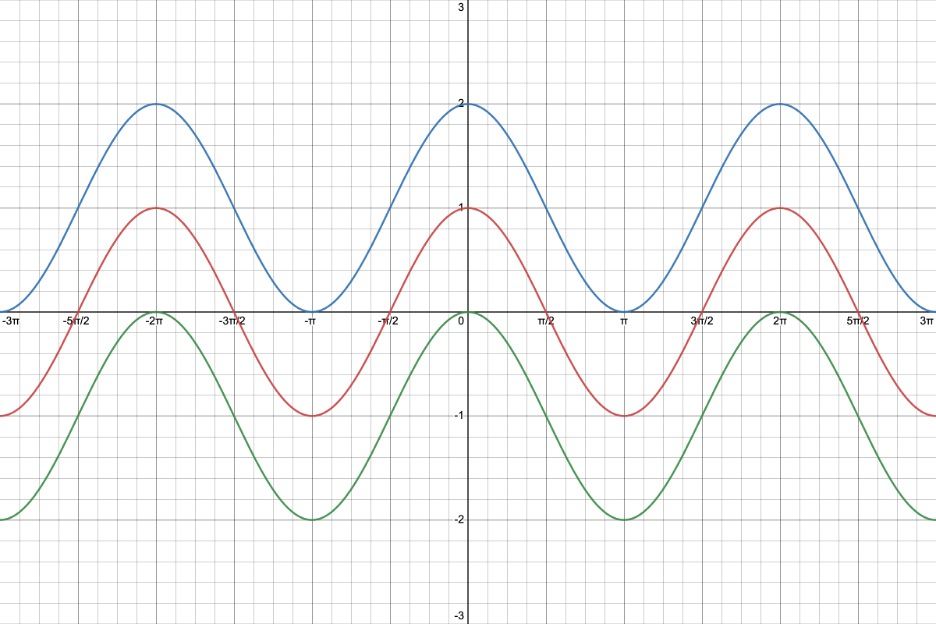
Following are the graphs of y = cos(x), y = cos(x) + 1, and y = cos(x)
1.
We used the Desmos online graphing calculator to make their pictures. You can find instructions on how to use Desmos at https://profstewartmath.com/Math127/A_CONTENTS/desmos.htm
red graph:
y = cos(x)
blue graph:
y = cos(x) + 1, d = +1 which indicates a vertical shift up of y = cos(x)
green graph:
y = cos(x)
1, d =
1 which indicates a vertical shift down of y = cos(x)
Strategy for Sketching Some Sine and Cosine Functions - see #1 through 5 in the "Examples" document
We will only sketch functions of the form y = a sin(bx) and y = a cos(bx).
- Determine the amplitude.
- Determine the period.
- Keep in mind the graph and characteristics of the basic function.
- Mark off a distance along the x-axis to represent the period of the representative picture.
- Divide the period into four equal intervals.
- Create the appropriate representative picture by using the beginning and ending point of each interval. Keep in mind the amplitude. Be mindful of a being positive or negative!
- Connect the points in (6) to form the representative picture.
- Copy the representative picture several more times along the negative and positive x-axis.
