TANGENT, COTANGENT, COSECANT, AND SECANT FUNCTIONS
Copyright by Ingrid Stewart, Ph.D. Please Send Questions and Comments to
ingrid.stewart@csn.edu.
![]()
Learning Objectives - This is what you must know after studying the lecture and doing the practice problems!
1. Memorize the shape and characteristics of the graph of the basic tangent function.
2. Memorize the shape and characteristics of the graph of the basic cotangent function.
3. Find the period of transformations of the basic tangent and cotangent functions.
4. Sketch certain transformations of the basic tangent and cotangent functions.
5. Memorize the shape and characteristics of the graph of the basic cosecant function.
6. Memorize the shape and characteristics of the graphs of the basic secant function.
![]()
In the previous lesson, we looked at the basic sine and cosie functions and their graphs. We also examined some transformations. In this lesson we will study the basic tangent and cotangent functions, their graphs, and some transformations. Lastly, there will be a brief overview of the basic secant and cosecant functions.
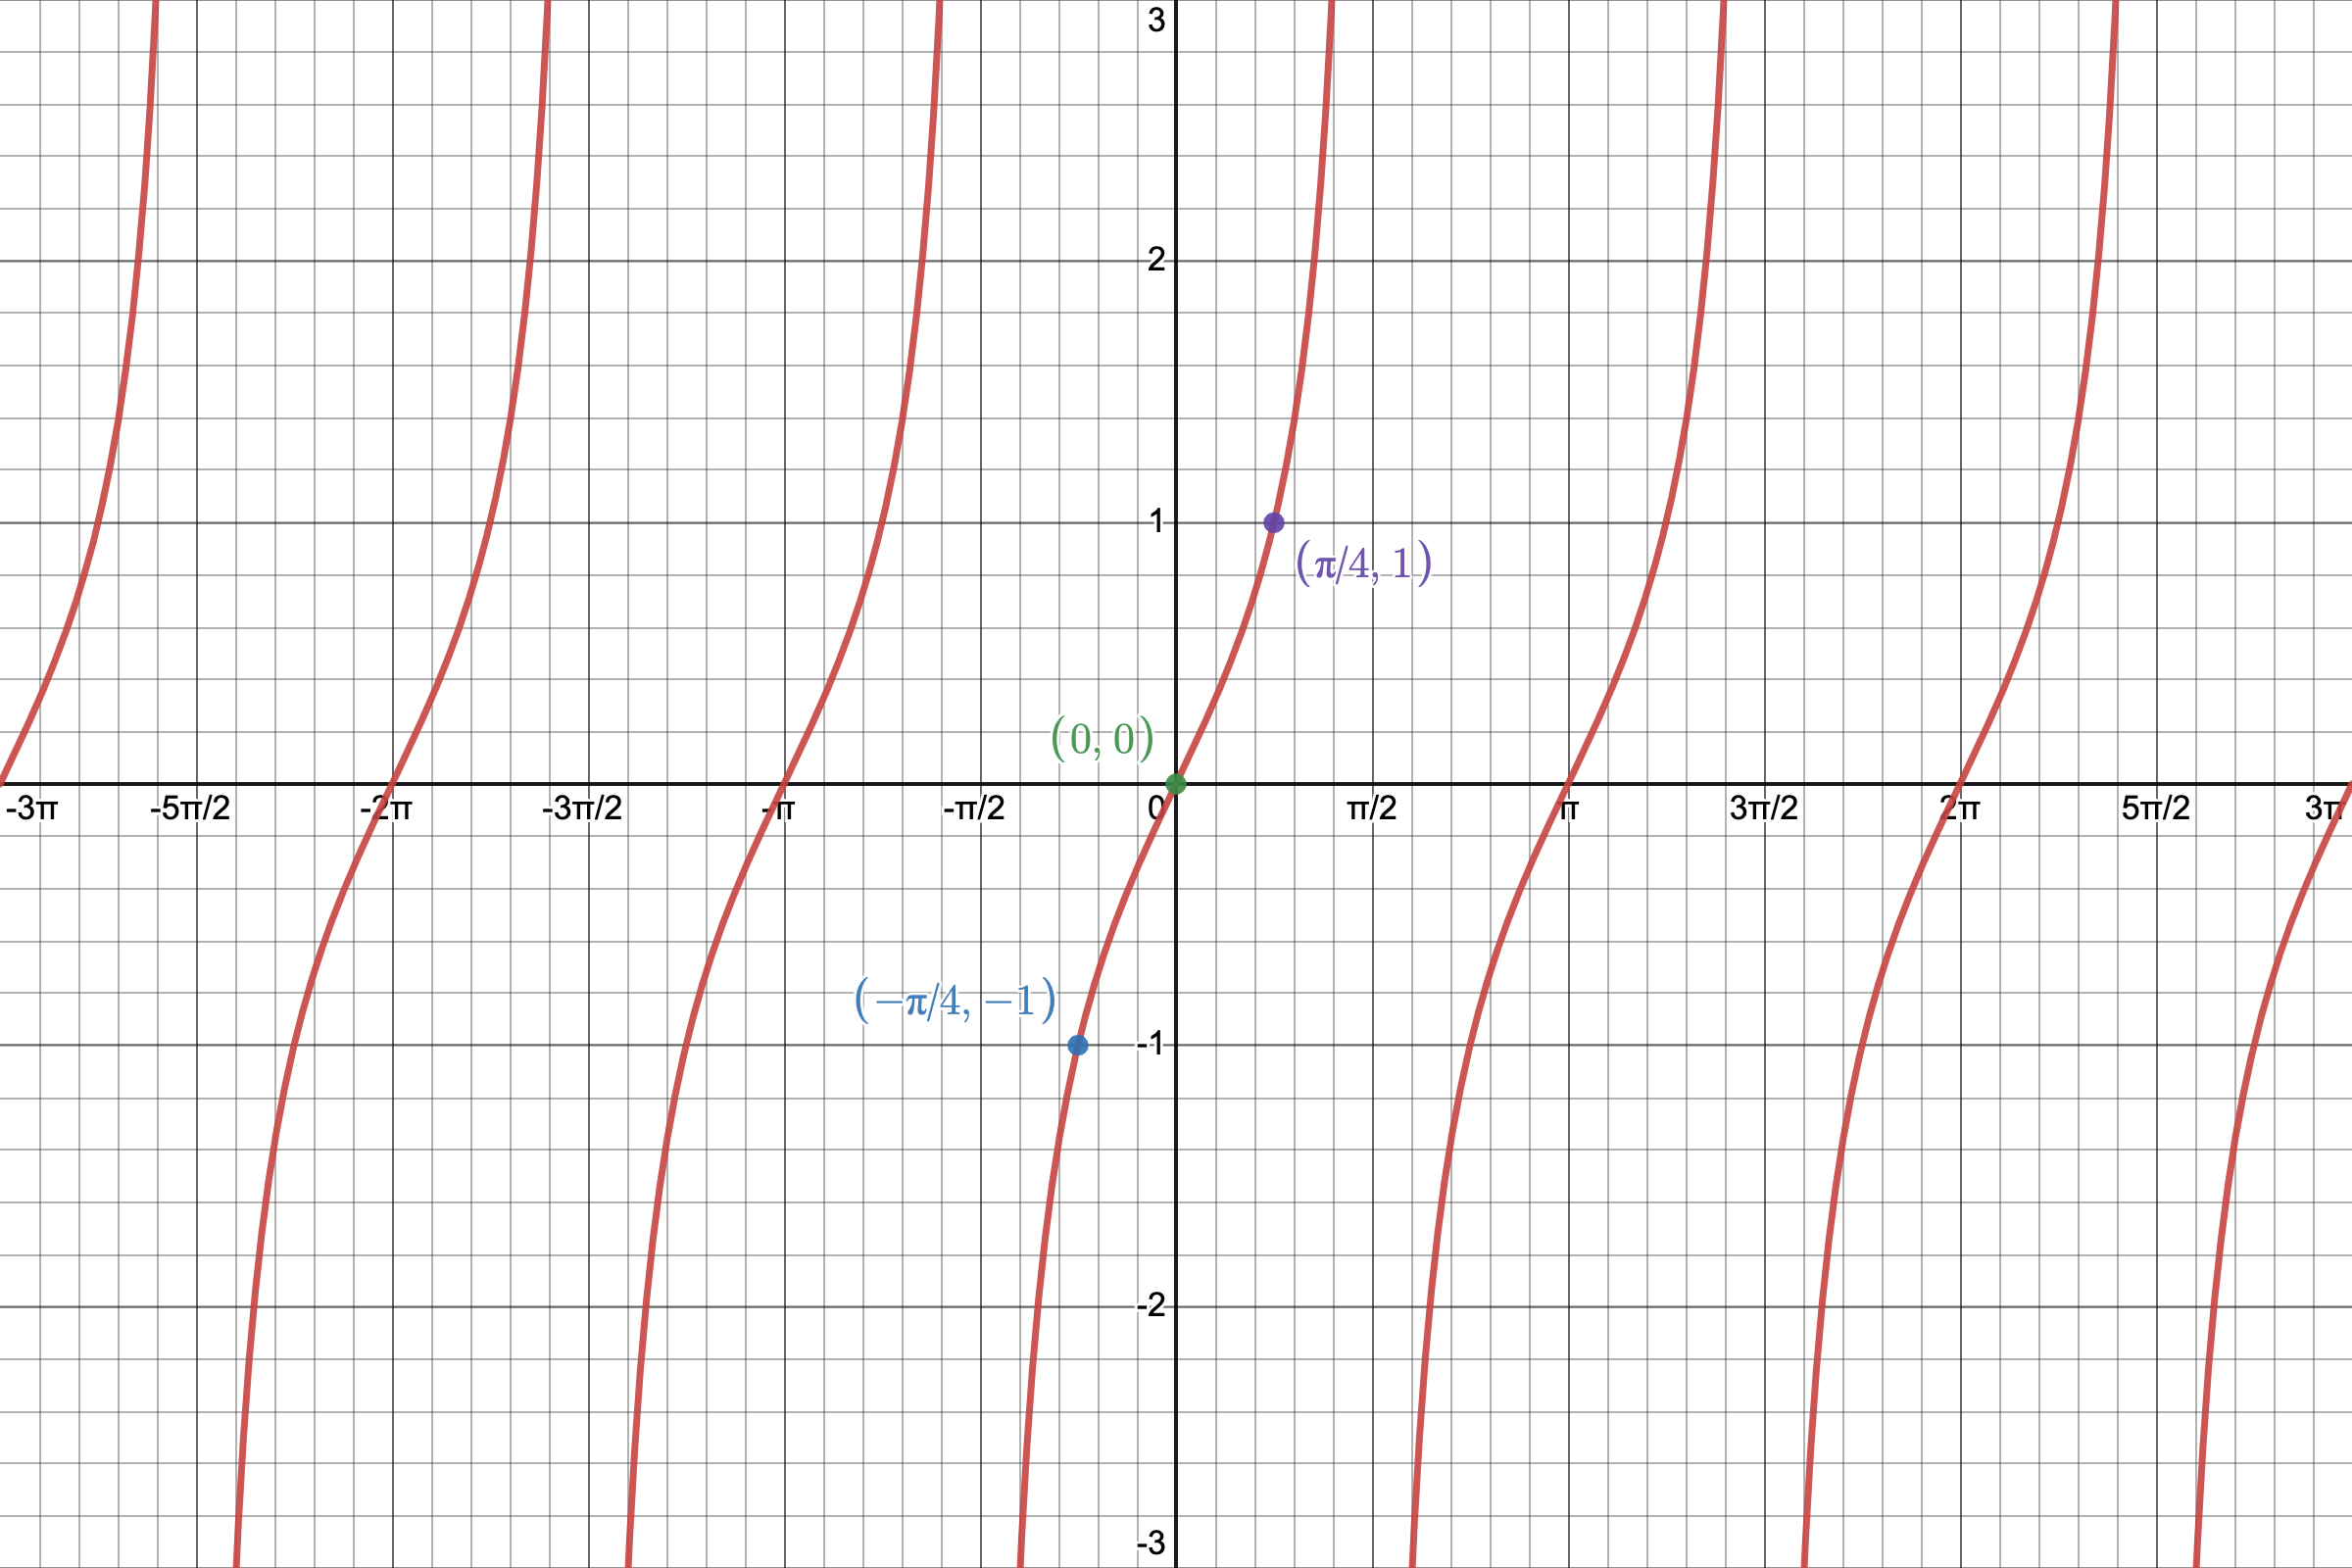
The Basic Tangent Function and its Graph
The tangent function is also called "periodic" because its graph also consist of identical pictures that repeat forever.
The domain contains all real numbers except for all number of the form
, where k is any integer. There, the tangen function is undefined.
We will use the Desmos online graphing calculator to make a picture of
. You can find instructions on how to use Desmos at https://profstewartmath.com/Math127/A_CONTENTS/desmos.htm
YOU MUST MEMORIZE THE SHAPE AND CHARACTERISTICS OF ITS GRAPH
Given
NOTE:
etc. (use your calculator, if necessary!)
Wherever the tangent is undefined, the graph of the tangent function will have vertical asymptotes***. The general equation of these vertical asymptotes is x =
*** From your algebra course you should know that vertical asymptotes are invisible vertical lines that a graph cannot touch or cross.
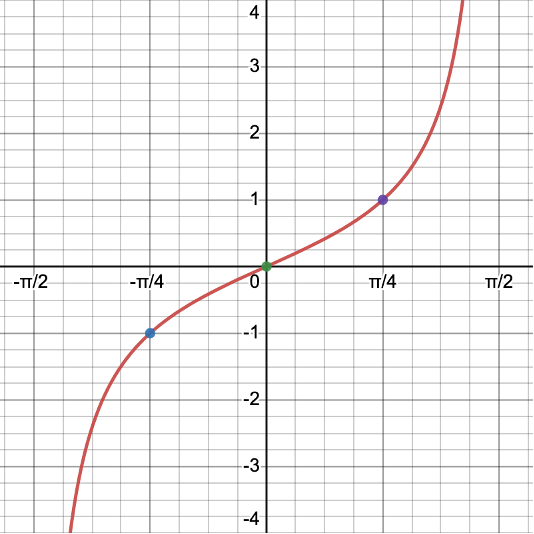
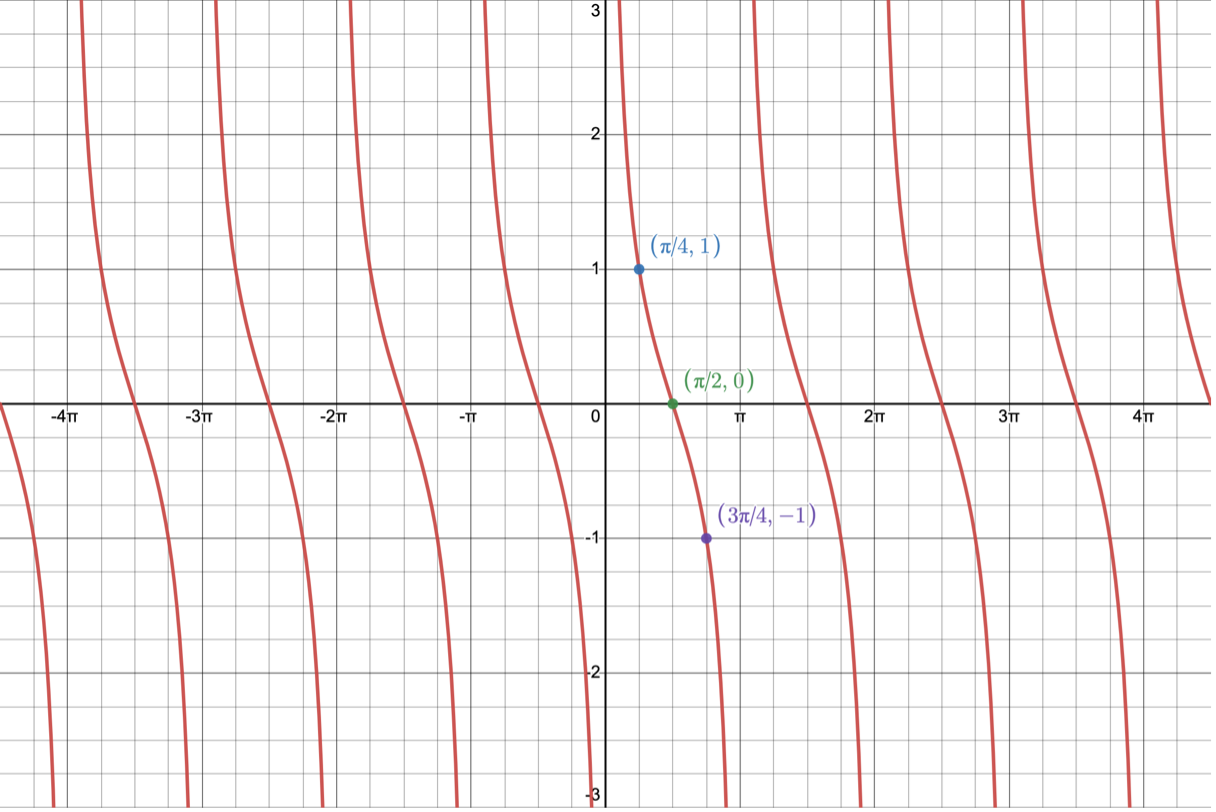
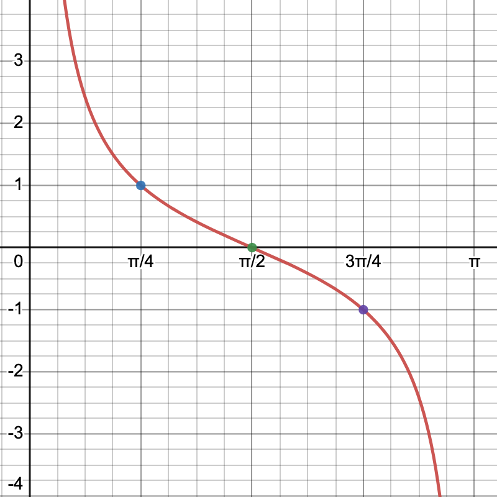
We will now plot these points and connect them keeping in mind the shape of the graph. The equations of the vertical asymptotes are
and
.
We call this portion of the graph of the tangent function its representative picture. It lies on the interval
which is called the PERIOD of the tangent graph. Clearly, it is
in length.
The representative picture repeats forever along the positive and negative x-axis and creates the graph of the basic tangent function.
The graph is concave up
to the right of the x-intercept and concave down
to its left.
Note that the representative picture is divided into four equal intervals.
- The graph starts with a vertical asymptote. The graph never touches the vertical asymptote, but is also never parallel to it.
- At the end of the first interval, we find an ordered pair and plot it.
- At the end of the second interval, the graph has an x-intercept.
- At the end of the third interval, we find an ordered pair and plot it.
- At the end of the fourth interval, there is a vertical asymotote. The graph never touches the vertical asymptote, but is also never parallel to it.
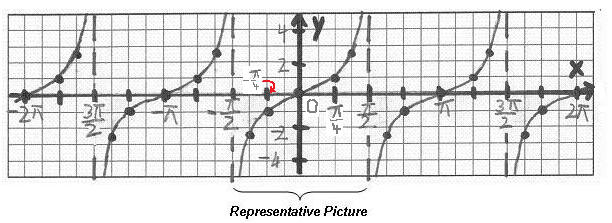
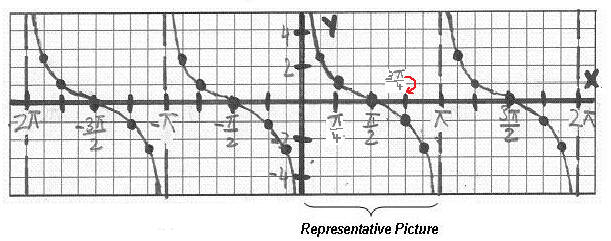
Below is a hand-drawn graph of the tangent function. Note that in a hand-drawn graph, we plot the vertical asymptotes as dashed vertical lines. In a computer-generated graph the asymptotes are not visible.
The Basic Cotangent Function and its Graph
The cotangent function is also called "periodic" because its graph also consist of identical pictures that repeat forever.
The domain contains all real numbers except for all number of the form k
, where k is any integer. There, the cotangent function is undefined.
We will use the Desmos online graphing calculator to make a picture of
. You can find instructions on how to use Desmos at https://profstewartmath.com/Math127/A_CONTENTS/desmos.htm
YOU MUST MEMORIZE ITS SHAPE AND CHARACTERISTICS!
Given
NOTE:
etc. (use your calculator, if necessary!)
Wherever the cotangent is undefined, the graph of the cotangent function will have vertical asymptotes. The general equation of these vertical asymptotes is
, where k is any integer.
We will now plot these points and connect them keeping in mind the shape of the graph. The equation of the vertical asymptote is
(the y-axis) and
.
We call this portion of the graph of the cotangent function its representative picture. The representative picture lies on the interval (0,
The representative picture repeats forever along the positive and negative x-axis and creates the graph of the basic cotangent function. Please note the difference between the representative picture of the tangent and that of the cotangent!
The graph is concave up
to the left of the x-intercept and concave down
to its right.
Note that the representative picture is divided into four equal intervals.
- The graph starts with a vertical asymptote. The graph never touches the vertical asymptote, but is also never parallel to it.
- At the end of the first interval, we find an ordered pair and plot it.
- At the end of the second interval, the graph has an x-intercept.
- At the end of the third interval, we find an ordered pair and plot it.
- At the end of the fourth interval, there is a vertical asymotote. The graph never touches the vertical asymptote, but is also never parallel to it.
Below is a hand-drawn graph of the cotangent function. Note that in a hand-drawn graph, we plot the vertical asymptotes as dashed vertical lines. In a computer-generated graph the asymptotes are not visible.
Transformations of the Basic Tangent and Cotangent Functions - see #1 through 5 in the "Examples" document
Next, we will investigate transformations of the basic tangent and cotangent functions. However, only the functions of the form y = a tan(bx) and y = a cot(bx), where a and b are real numbers with a and b NOT equal to 0.
The transformations will then be described as follows:
The number a
indicates a vertical stretch or compression of the graph of the basic tangent and cotangent functions. There is no amplitude involved as there is in the sine and cosine functions.
The number b
indicates a horizontal stretch or compression of the graph of the basic tangent and cotangen functions. This will affect the length of the period.
If b is between 0 and 1, the period of the basic tangent and cotangent function gets larger.
If b is greater than 1, the period of the basic tangent and cotangent function gets smaller.
The formula
calculates the period P of the graph of the tangent and cotangent functions.
Strategy for Sketching Some Tangent and Cotangent Functions - see #1 through 5 in the "Examples" document
We will only sketch functions of the form y = a tan(bx) and y = a cot(bx).
- Determine the period.
- Keep in mind the graph and characteristics of the basic function.
- Mark off a distance along the x-axis to represent the period of the representative picture. Keep in mind that the representative picture of the tangent function is bisected by the y-axis!
- Divide the period into four equal intervals.
- Draw dashed vertical lines at the beginning and end of the period to represent the vertical asymptotes (do not draw the y-axis as a dashed line).
- Create the appropriate representative picture by using three points marking the intervals.
- Connect the points in (5) to form the representative picture being mindful of the vertical asymptotes.
- Copy the representative picture several more times along the negative and positive x-axis.
The Basic Cosecant Function and its Graph

The cosecant function is also called "periodic" because its graph also consist of identical pictures that repeat forever.
The domain contains all real numbers except for all number of the form k
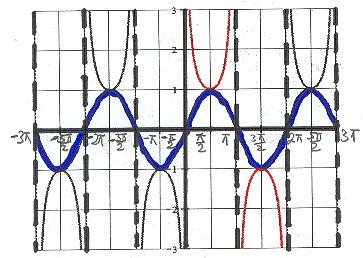
Below is a hand-drawn graph of the cosecant function together with the sine function. Note that in a hand-drawn graph, we plot the vertical asymptotes as dashed vertical lines. In a computer-generated graph the asymptotes are not visible.
YOU MUST MEMORIZE ITS SHAPE AND CHARACTERISTICS!
Wherever the cosecant is undefined, the graph will have vertical asymptotes. The general equation of the vertical asymptote is
Please observe the following:
- The representative picture of the cosecant function lies on the interval (0, 2
- The parabolic branches are separated by vertical asymptotes, which occur at the x-intercepts of the sine function because that is where the sine value is 0.
- The branches never touch the asymptotes, but they are also never parallel to them.
- There are neither x- nor y-intercepts.
- The branches have valleys where the graph of the sine function has peaks. Likewise, the branches have peaks where the graph of the sine function has valleys.
The Basic Secant Function and its Graph
The secant function is also called "periodic" because its graph also consist of identical pictures that repeat forever.
The domain contains all real numbers except for all number of the form
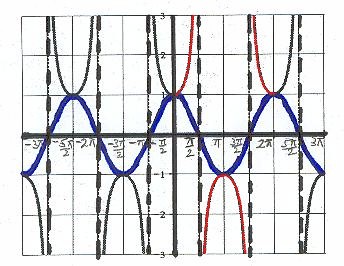
Below is a hand-drawn graph of the secant function together with the cosine function. Note that in a hand-drawn graph, we plot the vertical asymptotes as dashed vertical lines. In a computer-generated graph the asymptotes are not visible.
YOU MUST MEMORIZE ITS SHAPE AND CHARACTERISTICS
Wherever the secant is undefined, the graph will have vertical asymptotes. The general equation of the vertical asymptote is x =
Please observe the following:
- The representative picture of the secant function lies on the interval [0, 2
- The parabolic branches are separated by vertical asymptotes, which occur at the x-intercepts of the cosine function because that is where the cosine value is 0.
- The branches never touches the asymptotes, but they are also never parallel to them.
- There are neither x- nor y-intercepts.
- The branches have valleys where the graph of the cosine function has peaks. Likewise, the branches have peaks where the graph of the cosine function has valleys.
A Word about Transformations of the Basic Cosecant and Secant Functions
Just like for the sine, cosine, tangent, and cotangent functions, transformations are also possible for the basic cosecant and secant functions.
The formula
calculates the period P of the graph of the cosecant and secant functions.